Data, like people, comes in all sorts of shapes and sizes. Of course, while we can distinguish one person from another by sight alone, it’s a bit more complicated when it comes to abstract numbers. Fortunately, computers are as adept at distinguishing one numerical vector from another as easily as we can tell our aunt from our uncle, and, importantly, are just as good at finding similarities. While two different malware samples might appear completely different to a human’s evaluation, those same samples, stripped of their identities and reduced down to a vectorized representation of their most important qualities, might be suddenly found by a machine to have been twins all along. Insights like this are the goal of “clustering,” a machine learning technique based around finding the similarities and differences across and between a massive amount of data points. What follows is an overview of one of those techniques, K-means.
K-means clustering is by far the simplest clustering algorithm out there, but its simplicity belies its power. Through a mere two mathematical functions, one for judging distance and one for configuring averages, the dividing lines between groups of samples can be elucidated in stark relief. K-means, as a Python function, is really only concerned with one thing: the number of clusters you expect to find. After inputting this number (k), it generates k cluster centers (means) at random; think of these as fictional samples. After throwing these cluster centers into the data set, it’s simply a matter of assigning each sample to a cluster based on which center it is closest to and then “nudging” the center towards, well, the center of the points assigned to it. In other words, after every point has been assigned to a cluster, we take the average of each cluster to see what the “true” center of such a cluster is; this new center is added as a fictional sample, and the old center is discarded. This process is then repeated, until finally when the average of a cluster is taken it matches up with the center that formed it. It is from here that families can then be deduced.
At InQuest, we’ve used this technique to great success on samples based around our proprietary feature vector, a vector of ~200 numerical representations of various aspects of a VBA macro, such as its size, how many functions it uses, and even its country of origin. In addition to our unique vector, we have a unique way of utilizing our clusters as well; rather than just using K-means to find familial relationships between samples, we’ve been able to use it to expand our labeling as well. By examining the cluster to which an unlabeled macro is assigned and seeing to which label the members of that cluster tend towards (malicious or benign) we can get a pretty good idea of what label would fit that macro best. Thus, our clustering serves a dual purpose of both grouping and labeling our data. If one would like to explore this in more detail, an interactive Jupyter Notebook can be found on our GitHub, which allows one to play around with how K-means operates.
While we’re not going to open-source our feature-set, we are making available a collection of 10,000 VBA macro samples extracted from a mixed corpus of Microsoft Office documents and spreadsheets. We’ve taken a conservative approach to label each sample in the corpus as either malicious (~19%), benign (~1%), or unknown (~80%). The original files are available in their entirety via labs.inquest.net. Generally, when you’re looking to train a supervised model, you’ll want 80% of your data to carry labels. Our ratio here is opposite but that’s ok for an unsupervised model. In fact, the entire goal of this effort is to automatically expand on our labels within some threshold of confidence. The labels within classification.csv were applied through a variety of checks and balances to ensure fidelity. Within av_labels you can find a JSON dictionary containing the AV scan results for each of the documents. This data can of course be sourced to generate labels with varying thresholds of confidence. For example, rewriting “classification.csv” to label any sample with 4 or more AV positives as malicious, 0 positives as benign, and everything in between us unknown, will result in about 85% labeling of the corpus. In other words, there’s a number of knobs and tunables one can apply to leverage this corpus in a variety of ways.
What follows is a non-interactive walkthrough of the clustering approach that utilizes a feature set consisting of a simple collection of ~900 “interesting” VBA functions, as opposed to our proprietary feature set. This blog, corpus and notebook should be sufficient for folks looking to tinker with K-means.
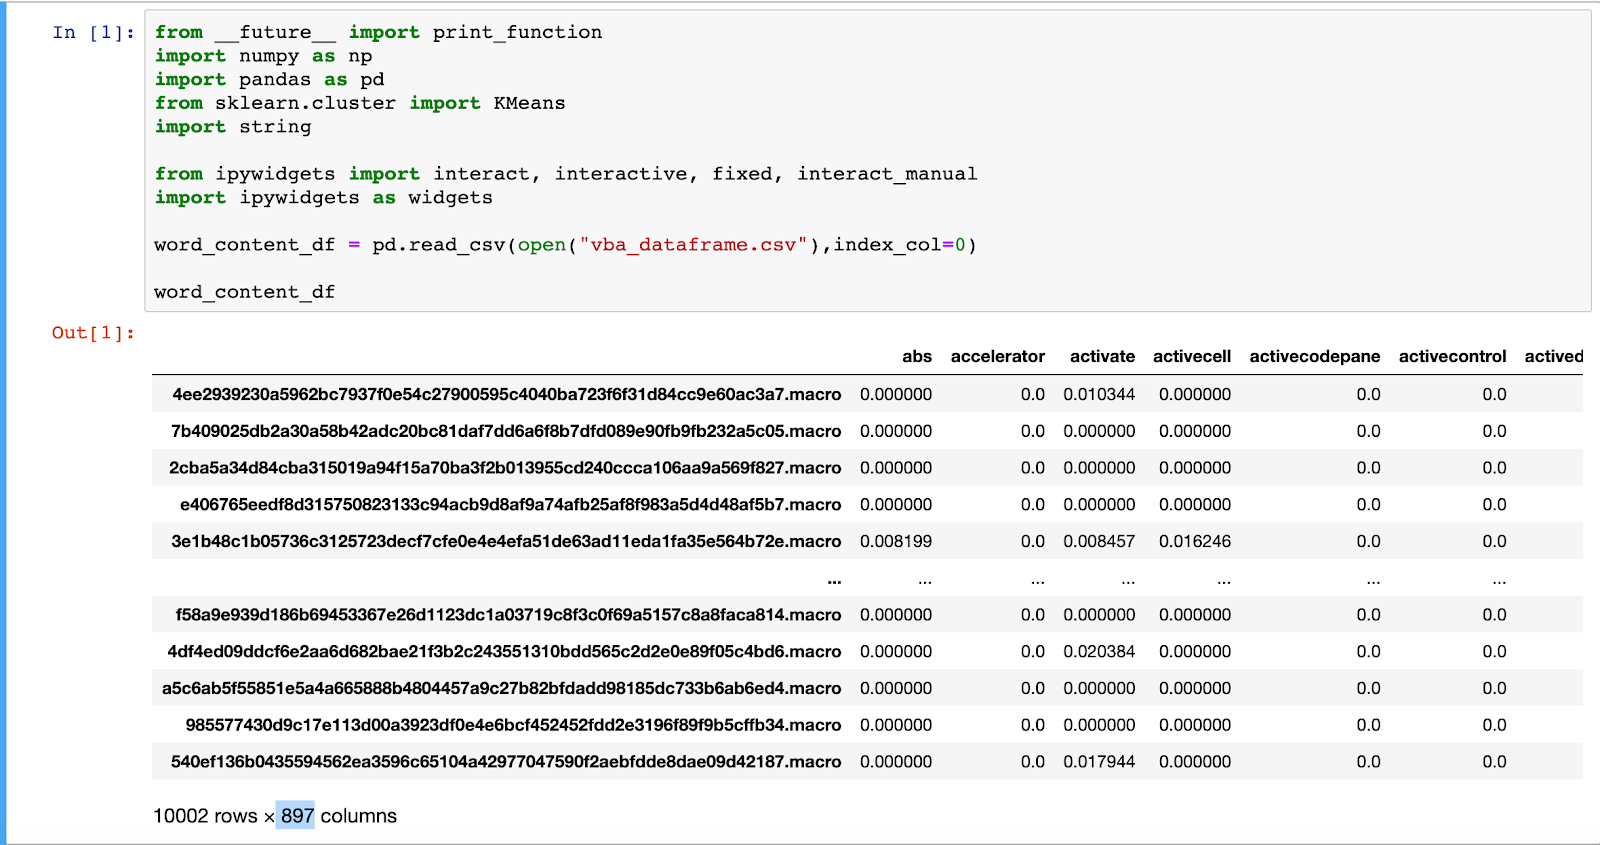
- First, we must import everything we need. This includes numpy and pandas for opening and reading our data frames, and our clustering algorithm. For our clustering algorithm, we use sklearn’s K-means classifier. We also load in our data into a panda’s data frame.

We now initialize our kmeans model. For our purposes we have it divide the data into 5 clusters, but this can be changed. We then fit our model to the data.
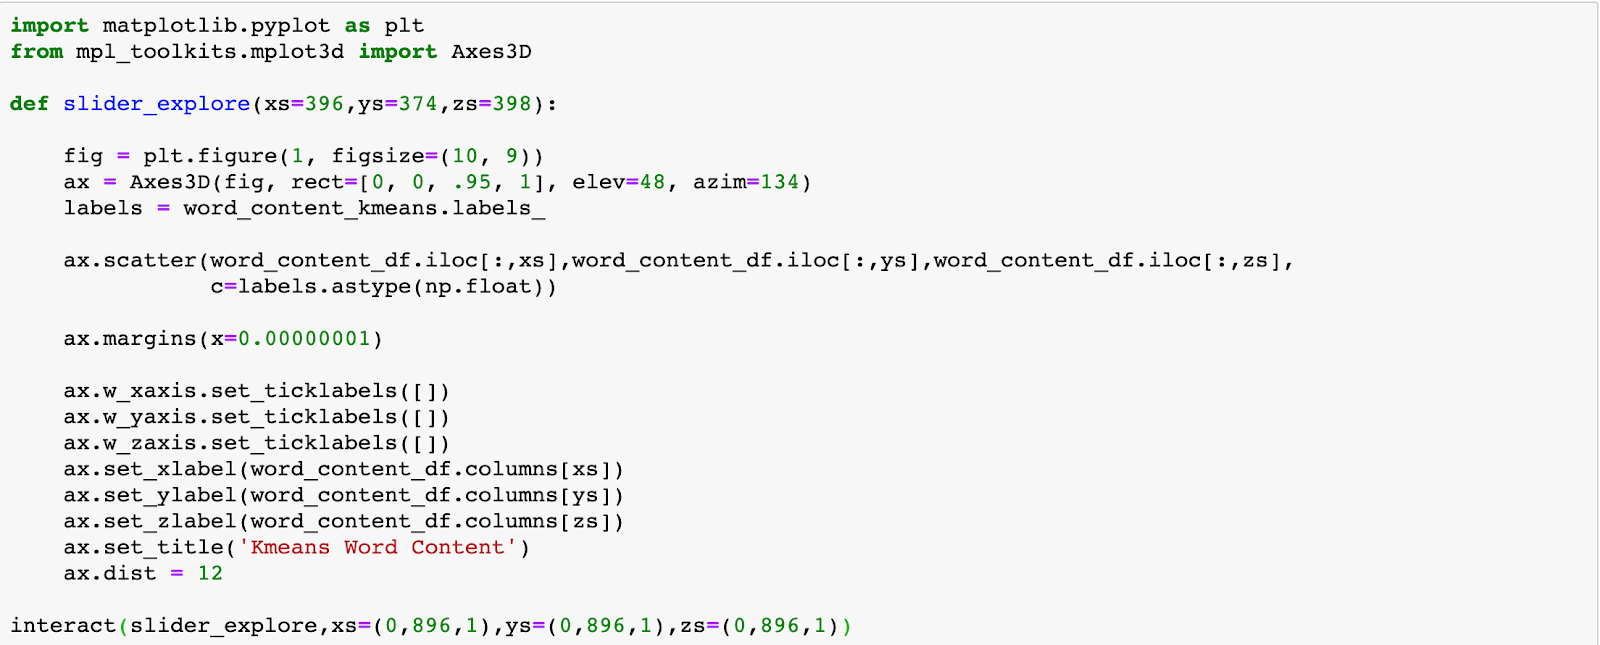
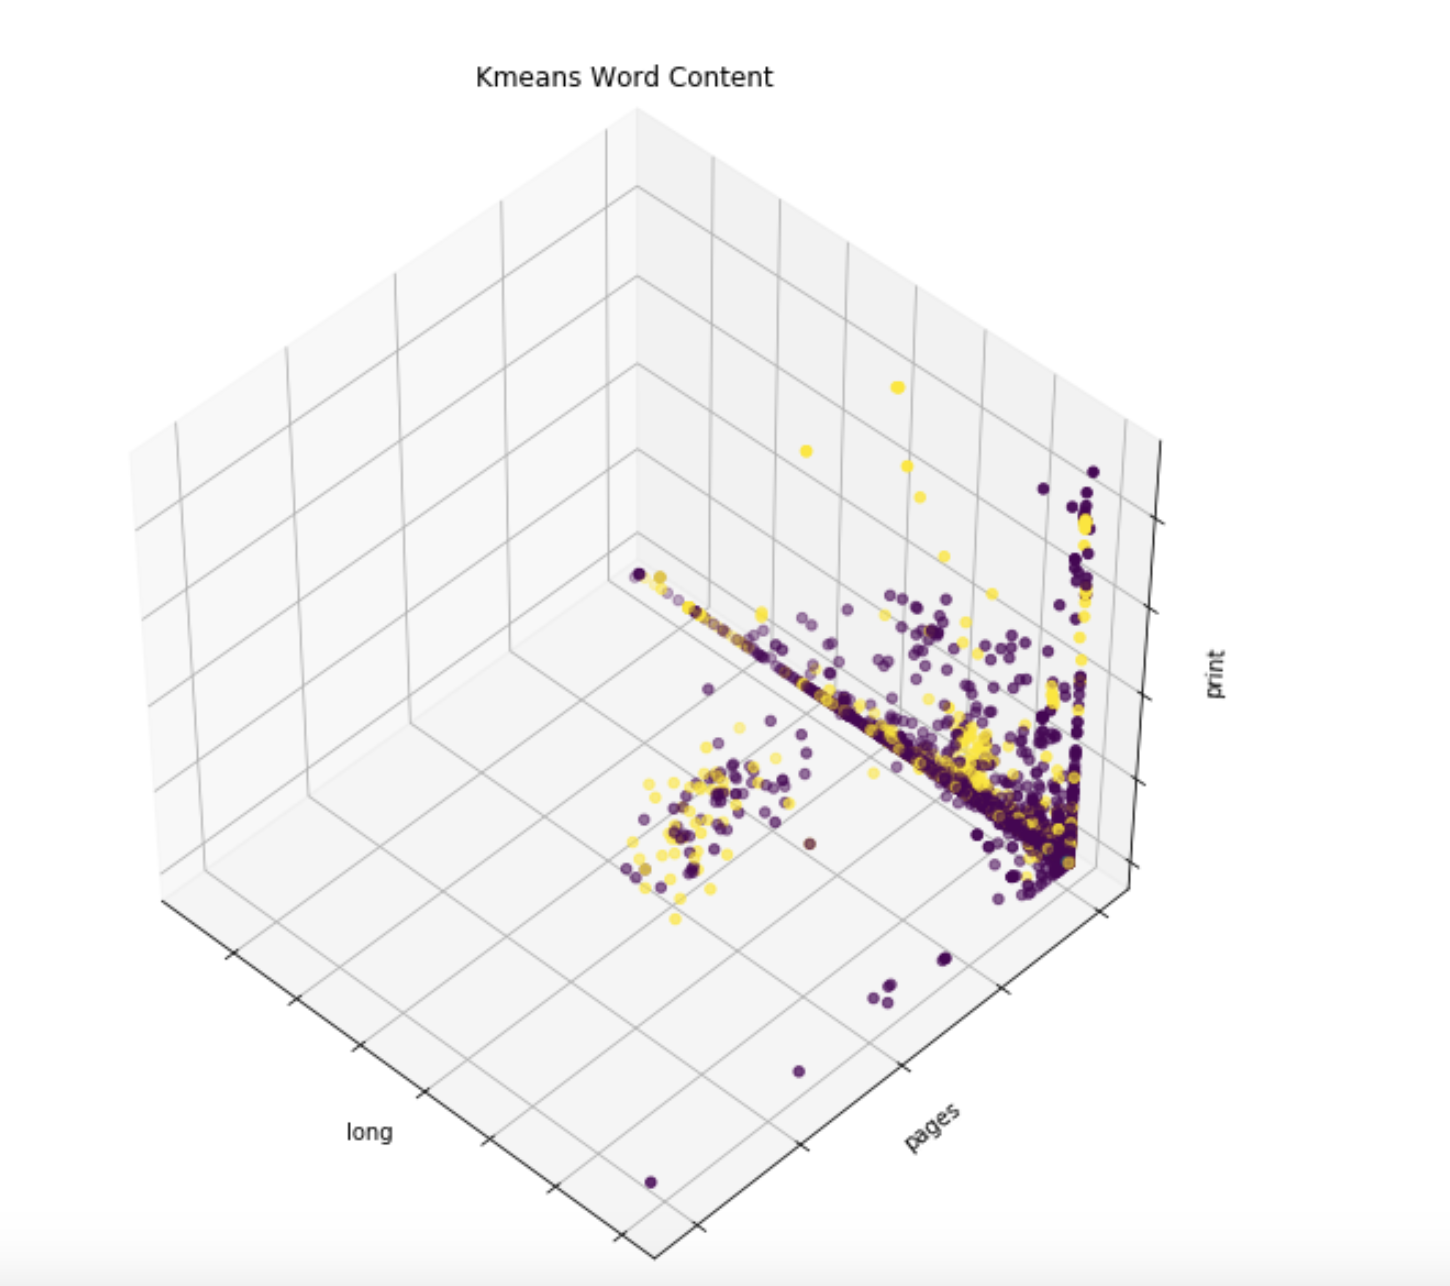
We are now able to get our data displayed.

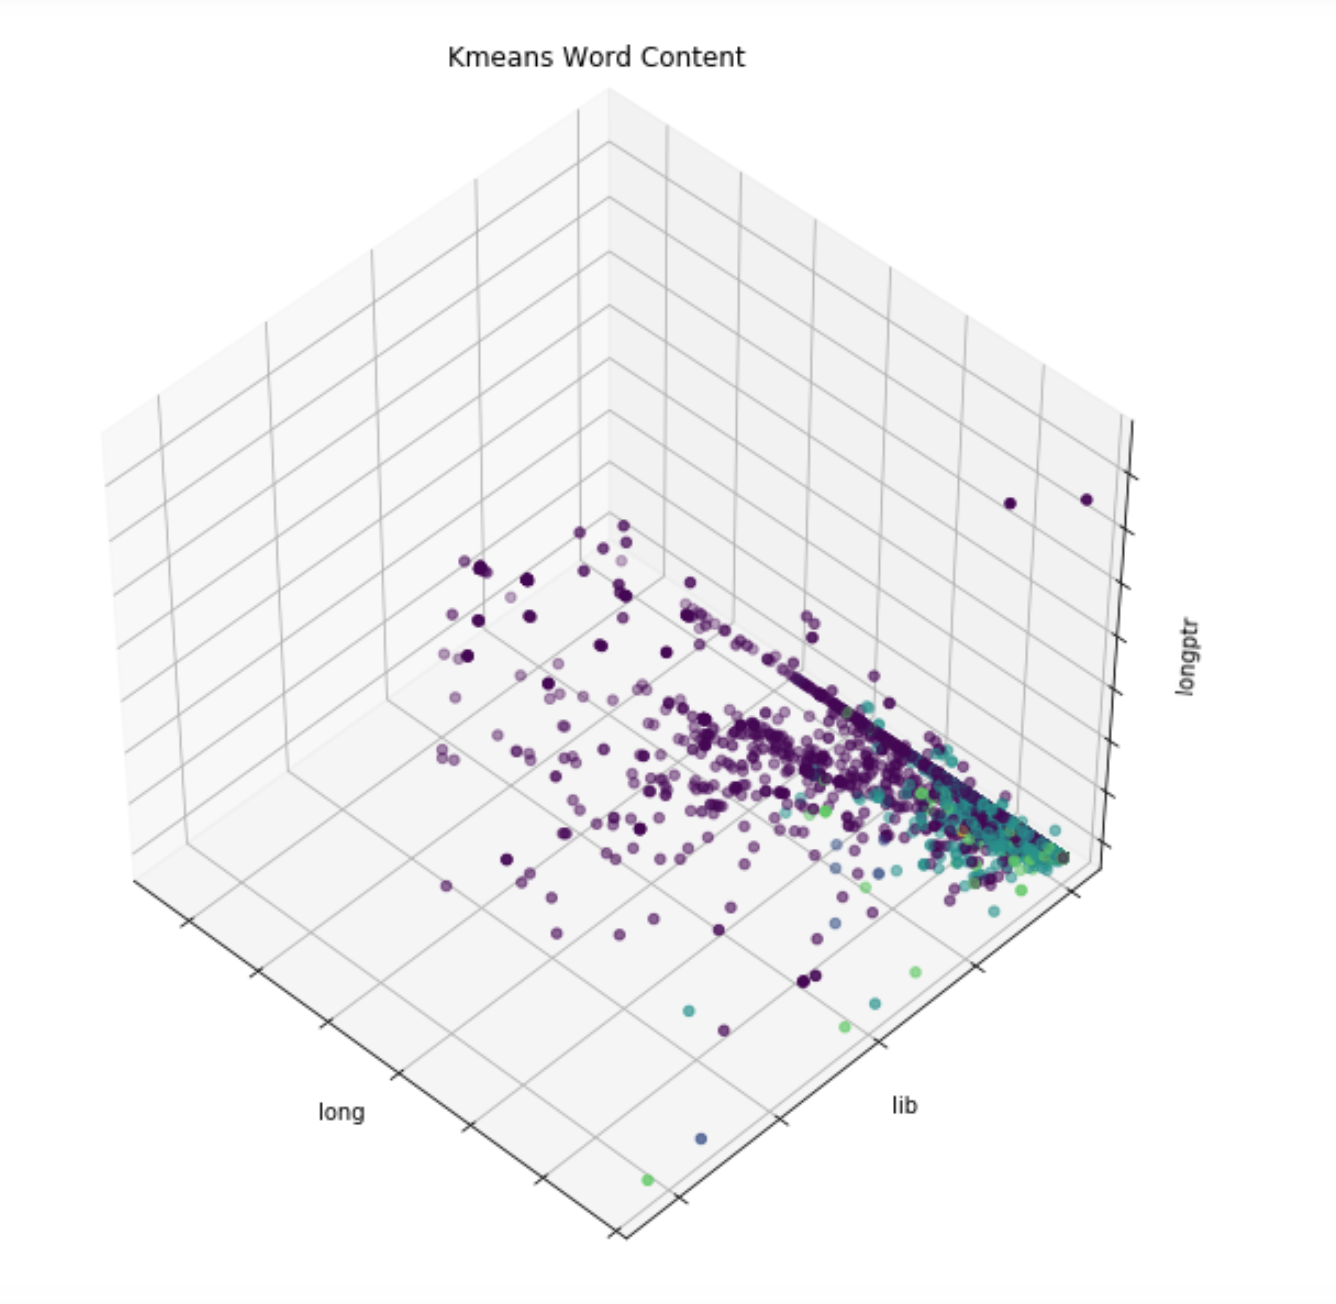
In addition to these clusters, we are also able to get information about how malicious/benign each one is, based on how their members are classified in our database. In this example, the purple points are unlabeled, and the yellow ones are malicious. As these are all grouped into a single cluster, we have evidence that those unlabeled points should be labeled malicious.
Two other unsupervised clustering algorithms that we’ve applied overtop this same data, but have not been detailed here, are DBSCAN and OPTICS, both of which are known as “density-based” algorithms, as opposed to the “centroid-based” k-means. They’re a bit more complicated, but can be more accurate as well, and keep an eye out for us discussing them in a future blog.
While this particular dataset focuses on macro malware, Sophos has released a production-scale dataset containing metadata, labels, and features for 20 million Windows Portable Executable files.
Sophos-ReversingLabs (SOREL) 20 Million sample malware dataset
How Effective Is Your Email Security Stack?
Did you know, 80% of malware is delivered via email? How well do your defenses stand up to today’s emerging malware? Discover how effectively your email provider’s security performs with our Email Attack Simulation. You’ll receive daily reports on threats that bypassed your defenses as well as recommendations for closing the gap. Free of charge for 30 days.
![]()